
Case study: Interactive statistical tests with the PROMPT GUI
Keywords:
Mann-Whitney, Kolmogorov Smirnov, Fisher's exact test, Chiq-Square test, graphical user interface, interactive
Questions 1: Are two numeric sets differentially distributed?
Examples are in perparation
Question 2: Is one or more categories over- or underrepresented?
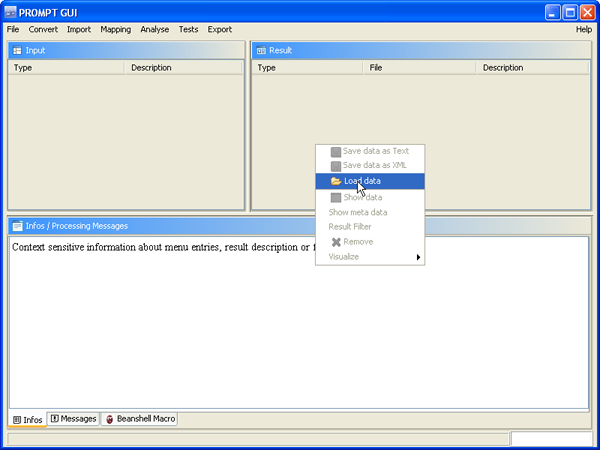
Step 1: Load the contingency table into PROMPT by right-clicking at the result area on the right hand side.
Example contingency data file: data.txt. Please note that the remark lines at the file beginning are obligate to load the data within the PROMPT GUI.
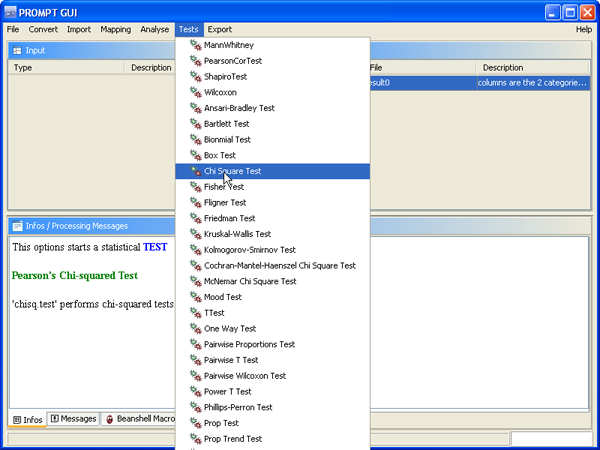
Step 2: Select the data object and choose the desired test on the contingency table for example the Chi-Square test.
Important practical tip: The test will be applied to the selected data entry. Therefore make sure that you have selected the row with your contingency table object as shown in the screen shot.
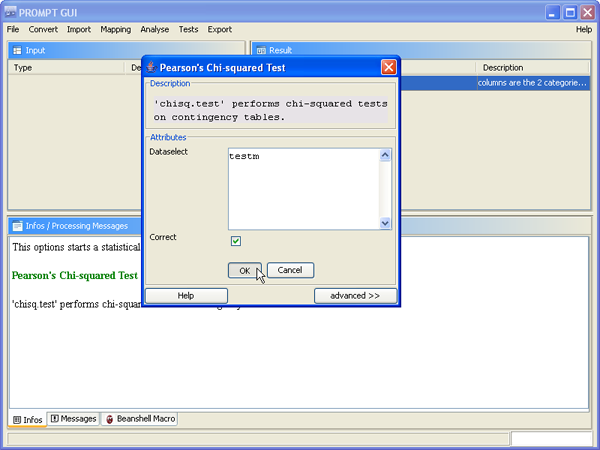
Step 3. Parameterize the test or use default settings.
In the dataselect field you can enter which data should be used. The syntax is exactly the same as in R, and in detail explained in the help. For using the default assumtations that our input is exactly a 2x2 consistency matrix type testm in the dataselect field.
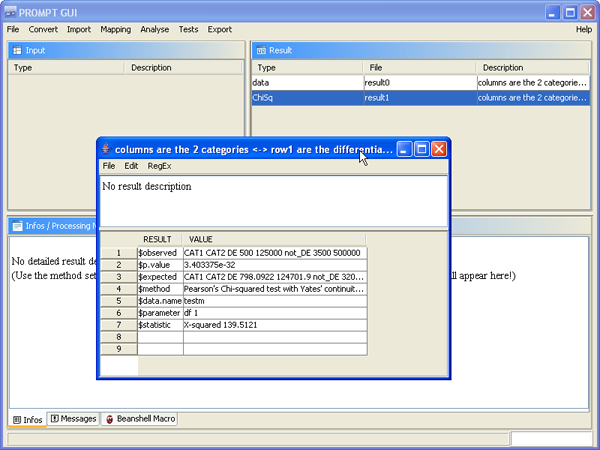
Step 4. View, save or further process the the results
Select the test result object. By using the right-mouse click at the ChiSq result entry you can for example view the result messages.
The Java commands that were executed in the background are logged in the Beanshell macro tab. You can simply copy and paste the command history to repeat the test or use it in a pipeline or large-scale processing queque.
|
Back to the Overview |