
Screenshots
 |
View PROMPT case study movies |
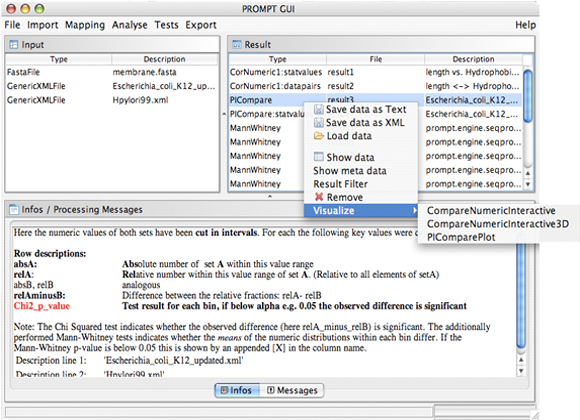
Graphical User Interface with context sensitive help in the lower information panel:
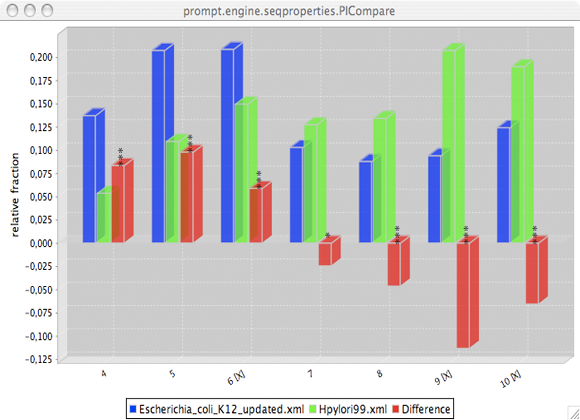
Example visualisation. Shown is a comparison of the numeric distribution of the isoelectric points of two protein sets.
Click here to go to the download page
Subscribe to the Community Mailing List