
Case study: Comparison of isoelectric point distributions
View as Movie  BeanShell
script along with data (zipped)
BeanShell
script along with data (zipped) 
Keywords:
computable sequence properties, visualisations (built in and generic), comparison of numeric distributions
Initial situation:
We are interested in how the extremophile Halobacterium salinarum and Buchenera sp APS are adapted to their environments. H.salinarum is a halophilic organism that lives in high salt concentrations and Buchnera is an endosymbiont of aphids.
Additionally we want to compare the two human pathogens H.pylori and E.coli and see how both are adapted to their specific environment. H.pylori lives in the acidic stomach whereas E.coli can be found in the basic intestine.
Questions:
- Do the protein pI distributions differ depending on the environmental needs?
Data:
We have multi FASTA files with the protein sequences downloaded from NCBI:
| File | Genbank identifier |
| Halobacterium_salinarum.fasta | NC_002607 |
| Buchnera_sp_APS.fasta | AP001118 + AP001119 |
| ecoli.fasta | NC_00913 |
| hpylori.fasta | AE001439 |
Steps
Step 1: Data import
Simply import the datasets to PROMPT by using the FASTA import feature. Choose “Import -> FASTA -> File” and choose “protein” as sequence type in the following dialog.
Step 2: Analysis & Results
Select both inputs (keep the CTRL-key pressed while clicking at both input lines).
Both datasets contain the amino acid sequences of the proteins. Therefore we can just let PROMPT calculate the isoelectric point of these proteins and see how the two organism differ in this respect.
From the PROMPT menu choose
"Analyze -> Computable Sequence Properties -> pICompare"this is equivalent to
"Analyze -> Generic Annotations -> Compare annotations between 2 sets -> Numeric feature comparison" and choosing "pI" in the following dialogs
PROMPT automatically applies the Mann-Whitney and the Kolmogorov-Smirnov test to the whole numeric distributions. The Mann-Whitney test (MW-test) is a rank test with the null hypothesis that the means of both distributions are equal. The Kolmogorov-Smirnov test (KS-test) tries to determine if two datasets differ significantly. The KS-test has the advantage of making no assumption about the distribution of data. Technically speaking, it is non-parametric and distribution free. Note, however, that this generality comes at some cost: other tests (for example Student's t-test) may be more sensitive if the data meet the requirements of the test. Additionally statistical values like median, standard deviation, minimum or maximum of both distributions are returned and can be shown in the PROMPT spread sheet viewer as shown in Figure 1.
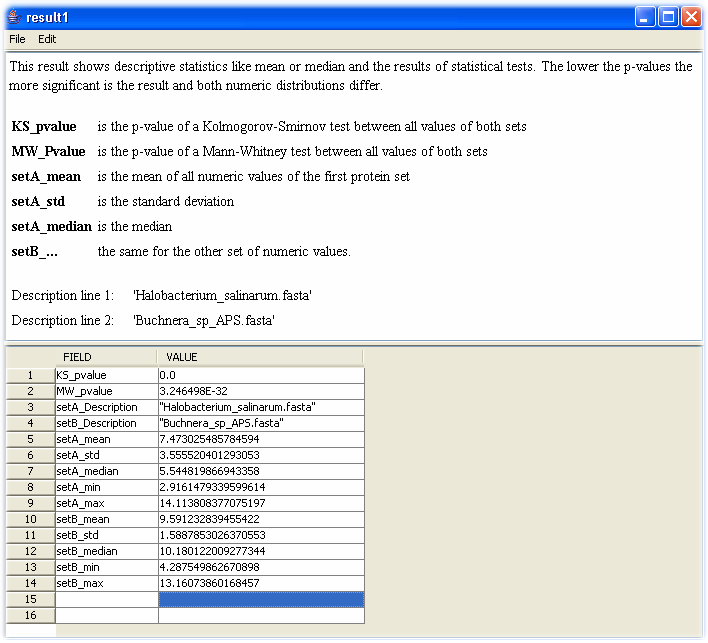
Figure 1. Screenshot of PROMPT's spreadsheet viewer showing results of a generic comparison of numeric distributions. For each results short descriptions explain the denotation of the respective values.
In addition to the statistical tests between distributions,a histogram with the absolute values in each bin as well as the relative fraction is calculated. The binning can be done automatically or easily customized with the help of a dialog guided wizard. This may allow one to detect local differences between 2 distributions that would not be detected in an overall analysis. Statistical significance is provided by a Chi-Square and a Mann-Whitney test for each bin separately. The Chi-Square test shows if the frequency difference is significant. The Mann-Whitney test indicates whether the distribution means within the bins differ.
To visualize the results, select the histogram and use the right mouse click on the PICompare- or Compare:numeric result to open the pop up menu and choose the Visualisation option.
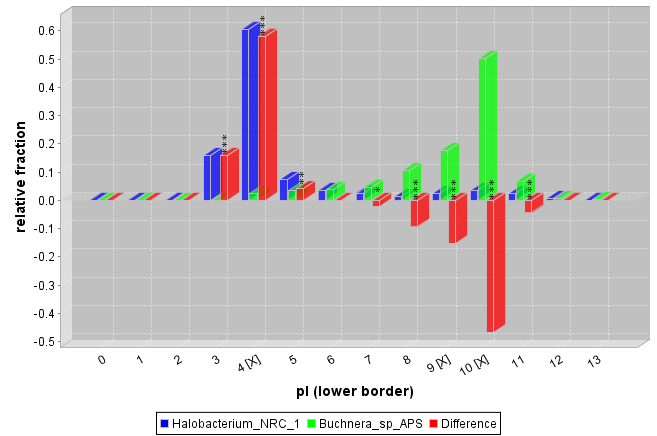
Figure 2. Comparison of the isolectric point distribution of the proteins of Halobacterium and Buchnera. On the Y-Axis the fraction of proteins that have a pI that falls within the respective bin relative to the amount of proteins in the Halobacterium or Buchnera set is plotted. The [X] in the interval labels indicates that a Mann-Whitney test returned a significant p-value at a significance level of 0.05 for the value within this bin. The stars on top of the red bars show that the observed difference differs significantly from the expectations as tested by a Chi-Square test (p-values * <0.05, ** <0.01, *** <0.001)
Summary:
- PROMPT can automatically calculate a multitude of sequence-based properties like pI or molecular mass.
- PROMPT can compare any numerical distributions:
- As shown in the external data example it is possible to use this type of analysis on any numeric external data.
- PROMPT tests for statistical significance automatically
- provides various immediately ready-to-go visualisations
Further exercises:
Compare the pI of E.coli and H.pylori. What would you expect and why is the result only at first glance surprising?
See also:
Comparison of theoretical proteomes: identification of COGs with conserved and variable pI within the multimodal pI distribution. BMC Genomics. 2005 Sep 9;6:116.Nandi S, Mehra N, Lynn AM, Bhattacharya A. Link
More:
Start PROMPT, Download PROMPT or sign up to the Community Mailing List
| Back to the Case studies Overview |
Next case study: Hydrophobicity vs. protein length |